
i-LINK Product Testing Report

(Peter LEE, UCI L2 coach)2023.6.8
(1) Introduction:
An excellent power meter product will be reflected in the following aspects:
- Accuracy: Cyclists are highly concerned about the accuracy of power meters. They want to be able to accurately measure and monitor the power output generated during their rides. If a product can provide highly precise power measurements, cyclists will consider it a good product.
- Reliability: Cyclists rely on power meter products for training and competitions, making the reliability of the product crucial. They expect the product to work properly under various weather conditions and maintain stable performance for a long time without being affected by external interference.
- Data Transmission and Compatibility: For cyclists who use power meters for data analysis and monitoring training progress, data transmission and compatibility are important considerations. If a power meter can seamlessly integrate with various devices such as bike computers, smartphones, and training applications, and reliably transmit data, cyclists will have a positive impression of the product.
- User Friendliness: Ease of use and operation is another key point of concern for cyclists. They want the power meter product to have an intuitive interface and a simple setup process to easily start using and interpreting the data.
- Data Analysis and Features: Cyclists are also interested in the data analysis and features that a power meter can provide. For example, whether the product can display and record important indicators such as real-time power, average power, and cadence, as well as whether it has advanced functions like training modes and data export.
- Battery Life and Endurance: Long rides and training sessions pose challenges to the battery life and endurance of power meter products. Cyclists expect the product to provide sufficient battery life to ensure continuous operation during extended rides or competitions.
- Design and Weight: Although not the most crucial factor, cyclists often also consider the design and weight of power meter products. They hope the product has a compact, lightweight, and stylish design to minimize its impact on the weight and appearance of the bike.
These seven aspects will be observed in the testing conducted here.
(2) Methodology:
The comparative method was employed to contrast the performance of I LINK with a leading brand in the market, GARMIN Vector power meter. The seven factors mentioned above were observed and compared.
(3) Test Results:
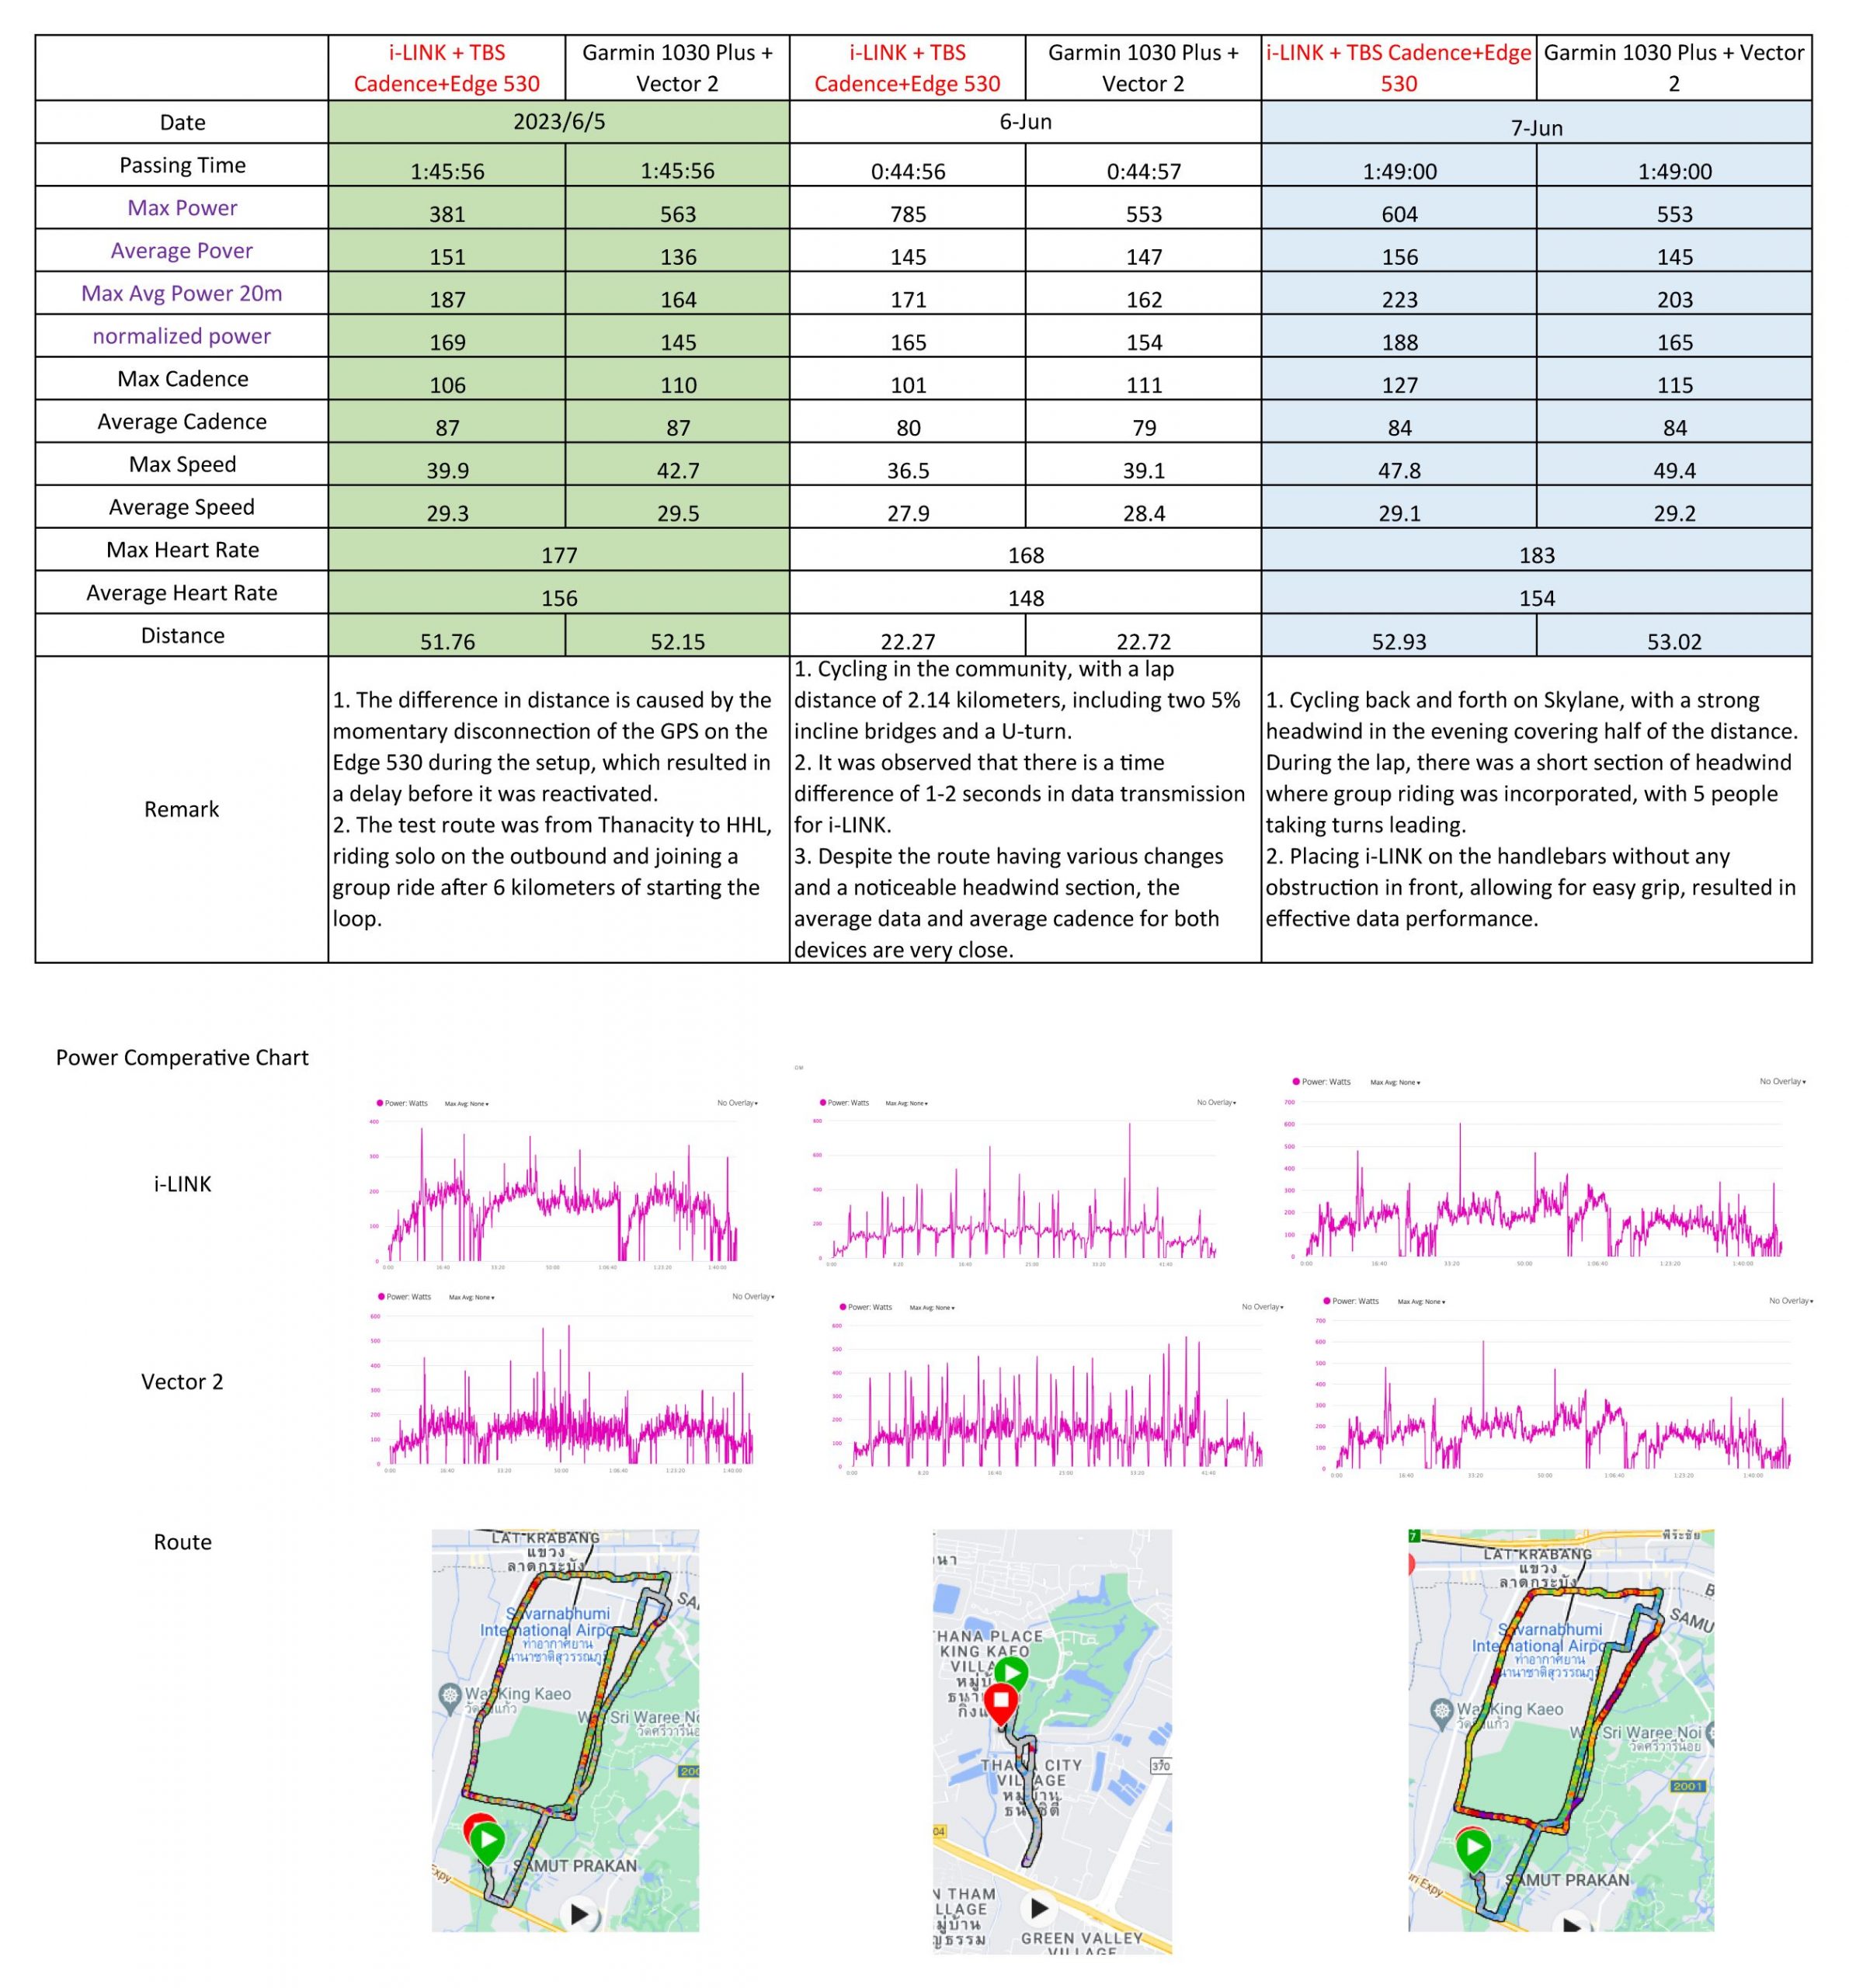
After three rounds of testing, the data performance comparison is depicted in the attached graph, as shown in Appendix One.
(4) Analysis and Interpretation:
- Accuracy: Power measurement varies among different brands, but I believe it is sufficient to compare the performance of a leading brand that exhibits stability. Based on the data above, the first and third tests followed the same route from the community to HHL (SL) Cycling Park. Both i-LINK and Vector2 (referred to as V2) demonstrated a good proportional relationship in terms of Max Avg Power 20m (referred to as 20M) and Normalized Power (referred to as NP). i-LINK utilizes algorithms to calculate power data, which is influenced by factors such as wind speed, bridge climbing, solo riding, and group riding. Therefore, the characteristics of the first and third tests perfectly reflect the environmental and terrain conditions of the tests. Additionally, the data from both tests align with my perception. Comparing the first and third tests, the presence of strong wind in the third test made it more challenging. From the data, both days achieved a speed of 29 km/hr, but the power output in the third test was noticeably higher. In terms of 20M, i-LINK produced an additional 36 watts (=223-187), while V2 produced an additional 39 watts (=203-164). In terms of NP, i-LINK generated an additional 19 watts (=188-169), while V2 produced an additional 20 watts (=165-145). This indicates that the data is quite close to each other.
- Reliability: With i-LINK’s data collection algorithm, based on the first and third tests conducted on flat sections, environmental wind conditions, and solo/group riding, both the data and personal perception confirm its high reliability. It is on par with V2 and shows no signs of inferiority. Comparing the results, i-LINK outperforms V2 by 36 watts in 20M (223-187) and V2 outperforms by 39 watts (203-164). In terms of NP, i-LINK exceeds by 19 watts (188-169) and V2 exceeds by 20 watts (165-145). This demonstrates that the data is quite close to each other.
- Data Transmission and Compatibility: i-LINK exhibits noticeable data transmission delay of approximately 1.5 seconds during startup. When performing actions such as climbing, it can be observed that the movements and effort change, but there is a delay in the displayed numbers on the cycling computer. This delay was particularly evident in the second test, which involved circuit riding with a distance of 2.14 kilometers per lap, including two bridges and a U-turn. However, this weakness was less apparent in the flat terrain tests conducted during the first and third trials. In terms of compatibility, the cadence sensor has an exclusive connection, meaning that once it is connected to the cycling computer, i-LINK cannot be connected simultaneously. Understanding this limitation can prevent users from experiencing difficulties when using the device. In my first attempt, I connected the cycling computer first, which resulted in the AROFLY app on my smartphone not displaying power data. Knowing this, such obstacles can be avoided in the future.
- User Friendliness: Once the setup is completed correctly (referring to point 3), I find it very user-friendly. The combination of i-LINK and Edge 530 is a perfect match, as the data from the Edge 530 can compensate for any shortcomings in the AROFLY data. For power training, the inclusion of metrics such as M20 and NP is crucial, and these two data points can be supplemented in the AROFLY app.
- Data Analysis and Features: For power training, metrics such as M20, NP(Normalized Power), IF (Intensity Factor), and TSS (Training Stress Score) should be included and can be supplemented in AROFLY.
- Battery Life and Endurance: The rated battery life is 15 hours. If it can be extended to 24 hours, it would be able to accommodate the usage of a one-day ride for cyclists participating in both the Northern High and Double Tower events.
- Design and Weight: It weights only 42 grams, which is lightweight.
(5) Discussion:
I think the product is good, and at this stage, it is important to focus on adding the data analysis mentioned in point 5. For future testing, it should also take into account data comparisons in rainy conditions, mountainous terrains, and circular routes. These aspects can be further tested in the second round.